
The listExtremes
8 lakes doing something unusual this week, from Lake Powell to Sam Rayburn Reservoir
Out of the 101 lakes we follow, these 8 are the ones moving hardest right now: record levels, feet of water gained or lost, sharp temperature swings and the strongest wind. The numbers, and what to do with them.
Every week a few lakes break out of the normal range. Here are this week's. Ranked by how far each one is from normal, with a line on the fishing at each.
-
1
Lake Powell, UT
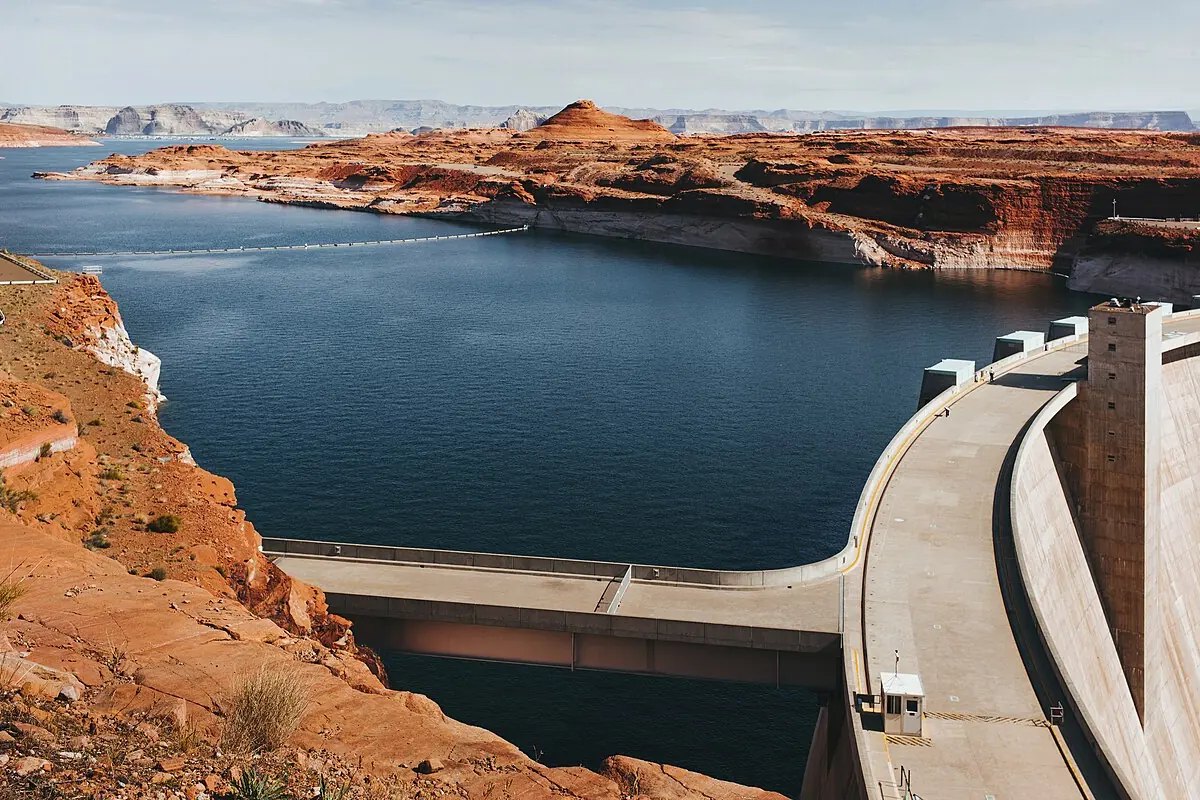
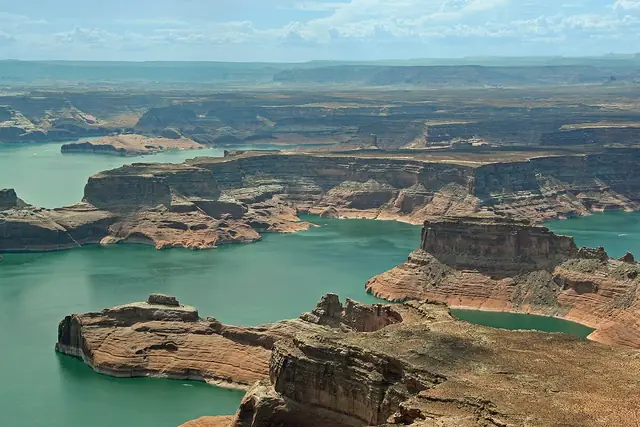
Lake Powell has risen 20 ft in 30 days, 4.8 ft of it this week. At 61°F, striped bass are the bet here. Watch for birds and surface feeding. Start at a point drop-off in 4 to 16 ft; try swimbait or live shad where bait is. The lake sits 43 ft below its usual level, so fish crowd onto fewer points and short ramps may not reach the water. Go Thursday (good bite).
Photo: Clément Bardot, CC BY-SA 3.0
-
2
Sam Rayburn Reservoir, TX
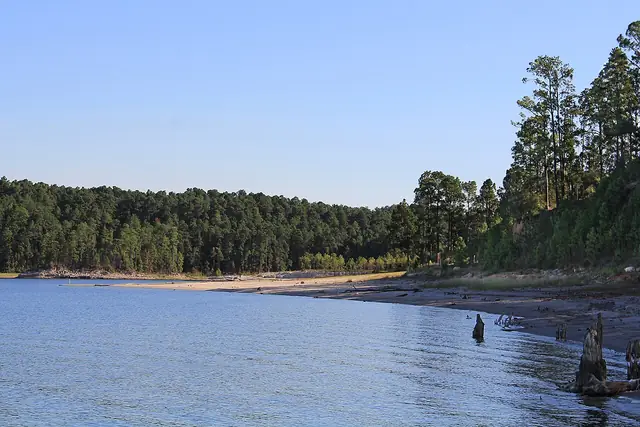
Sam Rayburn Reservoir reads 152.7 ft, at the bottom of a record that starts in 2016, 8.7 ft below normal for the season. At 65°F, largemouth bass are the bet here. They chase baitfish into creeks and coves. An upper arm in 24 to 28 ft is the place to begin; try small jig or minnow under a float. The lake sits 8.7 ft below its usual level, so fish crowd onto fewer points and short ramps may not reach the water. Thursday rates good for the bite.
Photo: Ricraider, CC BY-SA 3.0
-
3
Lake Hartwell, SC
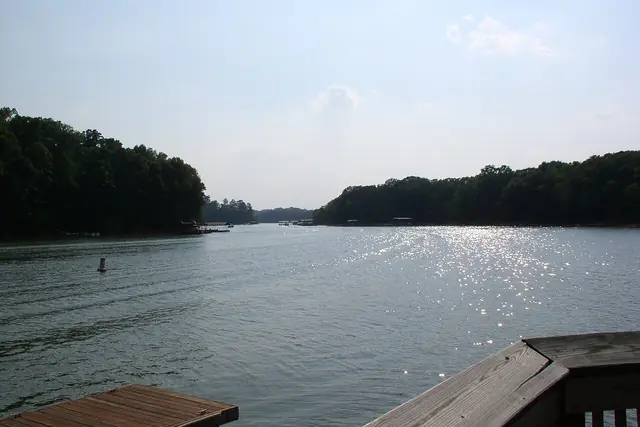
Lake Hartwell reads 647.6 ft, at the bottom of a record that starts in 2016, 8.4 ft below normal for the season. The water is 65°F and striped bass are in range. Start at a wind-blown bank in 4 to 16 ft; try swimbait or live shad where bait is. The lake sits 8.4 ft below its usual level, so fish crowd onto fewer points and short ramps may not reach the water. Saturday rates good for the bite.
Photo: blahedo, CC BY-SA 2.5
-
4
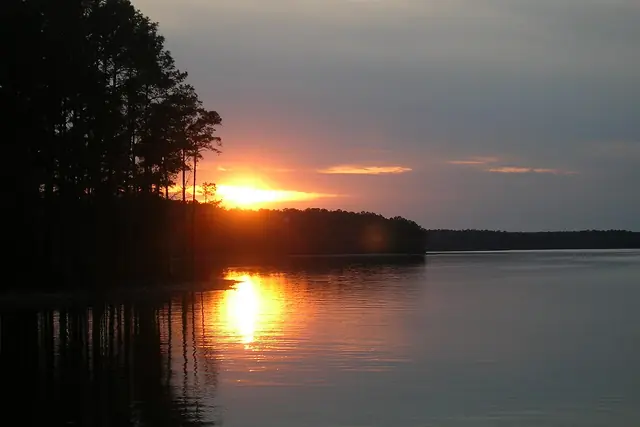
Lake Thurmond (Clarks Hill), GA
Lake Thurmond (Clarks Hill) reads 317.7 ft, at the bottom of a record that starts in 2016, 6.9 ft below normal for the season. The water is 67°F and largemouth bass are feeding. Start at a wind-blown bank; try swimbait or live shad where bait is. The lake sits 6.9 ft below its usual level, so fish crowd onto fewer points and short ramps may not reach the water. Go Friday (good bite).
Photo: Wikimedia Commons contributor, CC BY-SA 3.0
-
5
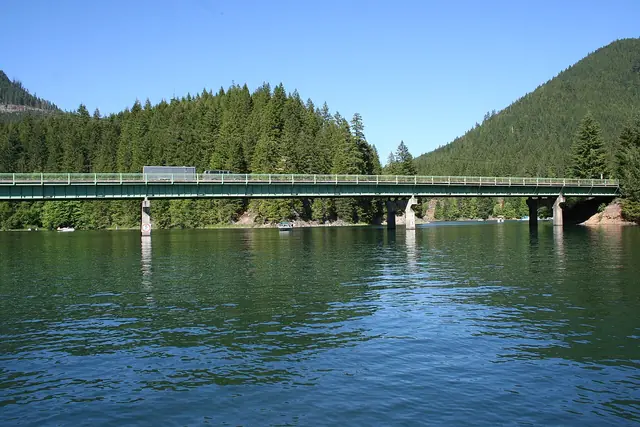
Detroit Lake, OR
Detroit Lake has fallen 18 ft in 29 days, 3.8 ft of it this week. The water is 50°F and trout are in range. Near the surface and along shorelines. A point drop-off is the place to begin; try spinner or spoon, troll slowly. The lake sits 6.8 ft below its usual level, so fish crowd onto fewer points and short ramps may not reach the water. Thursday rates good for the bite.
Photo: John2165 ( talk ), CC BY-SA 3.0
-
6
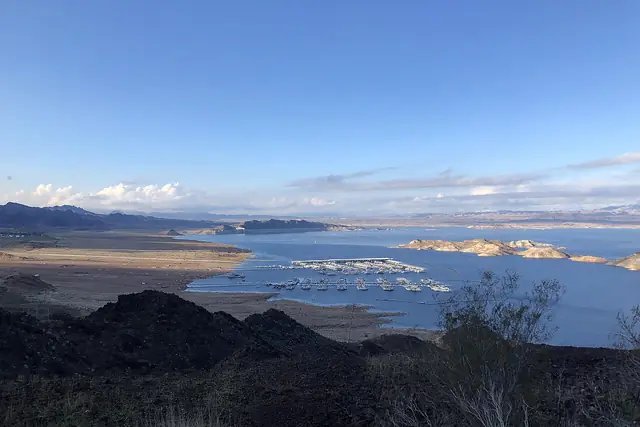
Lake Mead, NV
Lake Mead sits 31 ft below its usual level for this time of year, at 1,040.2 ft. 68°F at the surface puts largemouth bass first in line. Start at a point drop-off in 20 to 24 ft; try swimbait or live shad where bait is. The lake sits 31 ft below its usual level, so fish crowd onto fewer points and short ramps may not reach the water. Go Thursday (good bite).
Photo: Julianibarra (CC0)
-
7
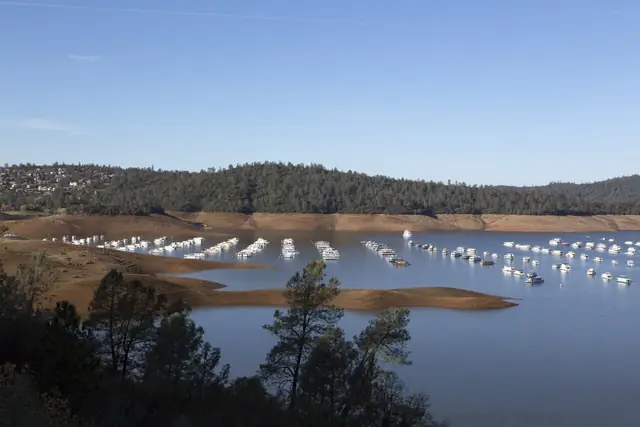
Lake Oroville, CA
Lake Oroville has fallen 12 ft in 30 days, 2.4 ft of it this week. 58°F at the surface puts spotted bass first in line. Start at a point drop-off in 12 to 24 ft; try spinner or spoon, troll slowly. Plan to cover water: the lake spreads over about 15,800 acres at full pool. Go Thursday (good bite).
Photo: Carol M. Highsmith (public domain)
-
8
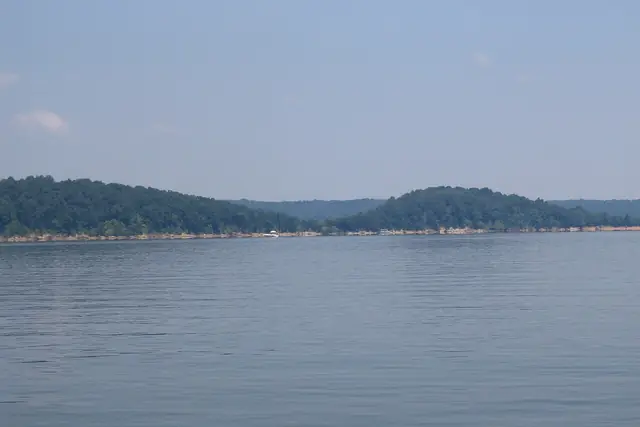
Lake Monroe, IN
Surface water on Lake Monroe fell 8°F in 11 days, to 53°F. The water is 53°F; expect to work for bites. A wind-blown bank in 4 to 16 ft is the place to begin; try small swimbait or spinner, follow the birds. It is a big piece of water: about 10,800 acres at full pool. Go Thursday (good bite).
Photo: emu4286, CC BY 3.0
Water temperature on the list
Surface temperature on the latest clear reading for each lake, warmest first.
How to read these numbers
A record low or high is measured against the daily readings we hold for that lake, which start around 2016, not against the lake's whole history. A fast rise usually means heavy rain or dam releases upstream; a fast drop is usually a managed drawdown. Temperature swings come from the weather over the lake, not from the lake itself.
Each lake page carries the full chart and today's bite outlook. Levels and temperatures update daily; the wind figures are forecasts and can change.
Before you go
A lake at the extremes is a lake where the ramps, the hazards and the fish are not where they usually are. Check the lake page before you tow, and if the water is cold, wear the life jacket.
Lake by lake
- Lake Powell61°F61°F water, level rising, 43 ft below normal, calm this afternoon.
- Sam Rayburn Reservoir65°FClear water, 65°F water, level steady, 9 ft below normal, calm this afternoon.
- Lake Hartwell65°FClear water, 65°F water, level steady, 8 ft below normal, calm Friday morning.
- Lake Thurmond (Clarks Hill)67°FClear water, 67°F water, level falling, 7 ft below normal, calm Friday morning.
- Detroit Lake50°F50°F water, level falling, 7 ft below normal, calm this afternoon.
- Lake Mead68°FClear water, 68°F water, level rising, 31 ft below normal, calm this afternoon.
- Lake Oroville58°FAlgae likely, 58°F water, level falling, 2 ft above normal, calm this afternoon.
- Lake Monroe53°FSlightly murky, 53°F water, level steady, near normal, calm tomorrow morning.
Your lake every morning
Water temperature, level, wind and bite times on your phone.

Read the guide
Related reports
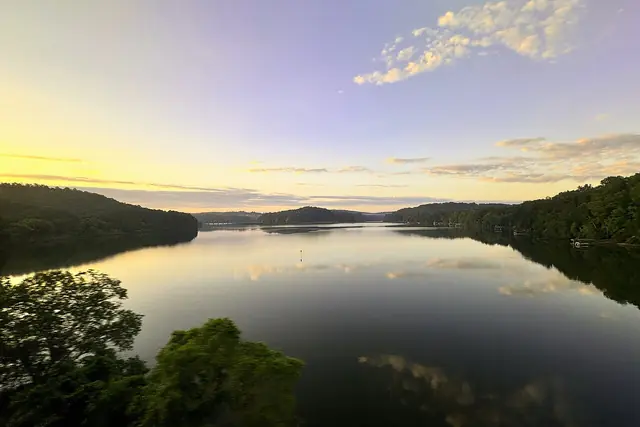 Deep dive Extremes · South Carolina
Lake Hartwell hits a 10-year low: the ramps, the hazards and where the fish went
Lake Hartwell has reached water this low for the first time since at least 2016. Here is the number, the context and how to fish it.
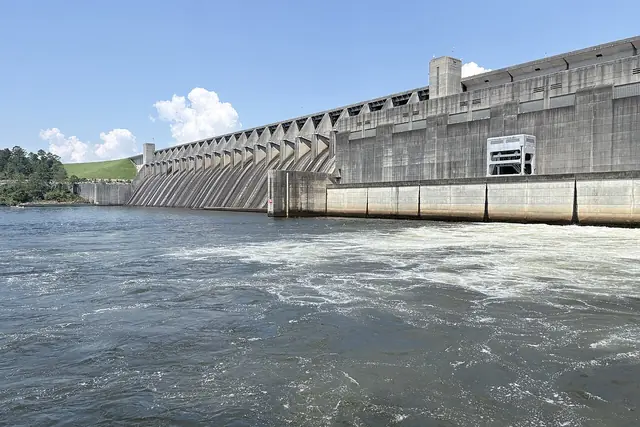 Deep dive Extremes · Georgia
Lake Thurmond (Clarks Hill) is at its lowest level in at least 10 years
The gauge on Lake Thurmond (Clarks Hill) reads 317.7 ft, under the lowest reading in our records, which go back to 2016. What that means for launching, for safety and for the fishing.