
The listLake levels
20 lakes running low: Lake Powell 43 ft below normal, Lake Mead 31 ft
Of the 64 lakes we follow with a daily level reading, 20 sit 2 ft or more below their usual level for this time of year. The list, lowest first, with how far each is from its lowest reading since at least 2016, which way it is moving and what that does to the ramps and the fishing.
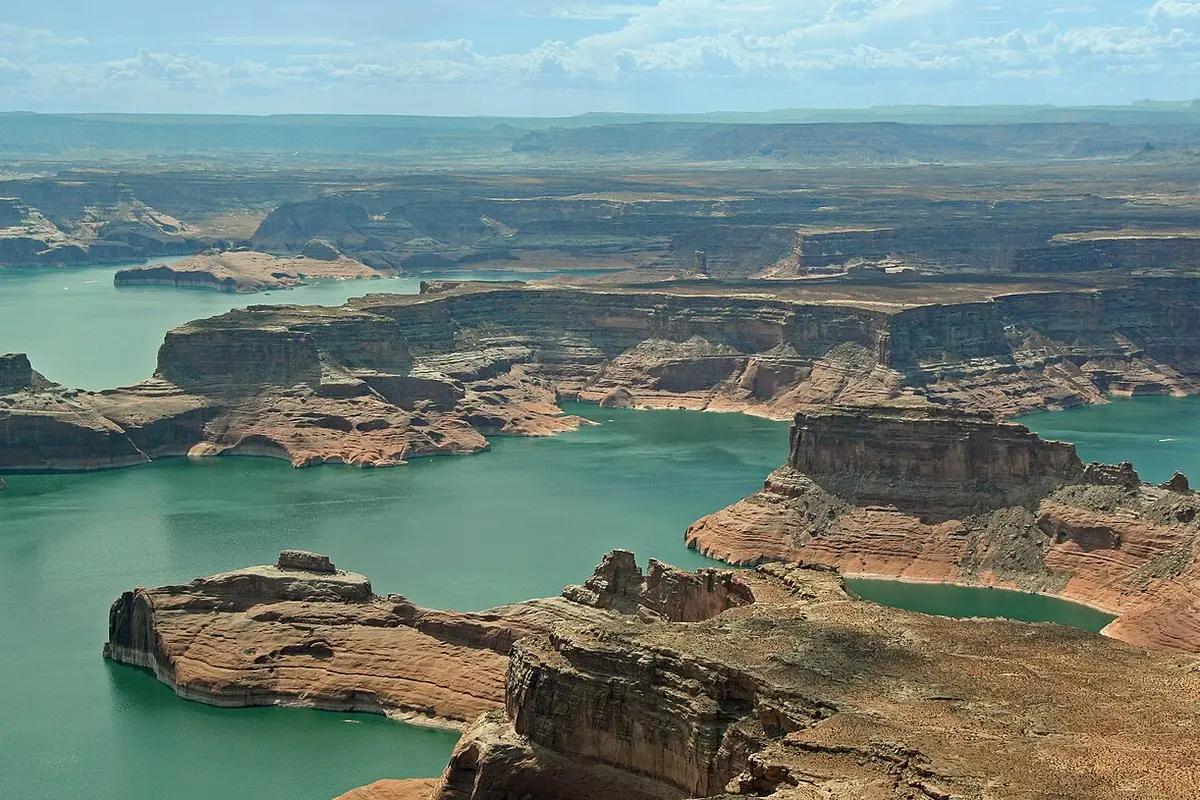
A lake below normal is not an empty lake, but it is a different lake: shorter ramps, exposed humps, fish squeezed onto fewer spots. Of the 64 lakes with a daily reading, 20 are at least 2 ft under their seasonal normal this week, and 3 of them are at the lowest level in our records, which start around 2016.
At the other end, 5 lakes are a foot or more above normal: Lake Berryessa (+5.2 ft), Lake Mohave (+2.1 ft), Lake Kissimmee (+1.9 ft), Milford Lake (+1.8 ft) and Lake Oroville (+1.5 ft).
-
1
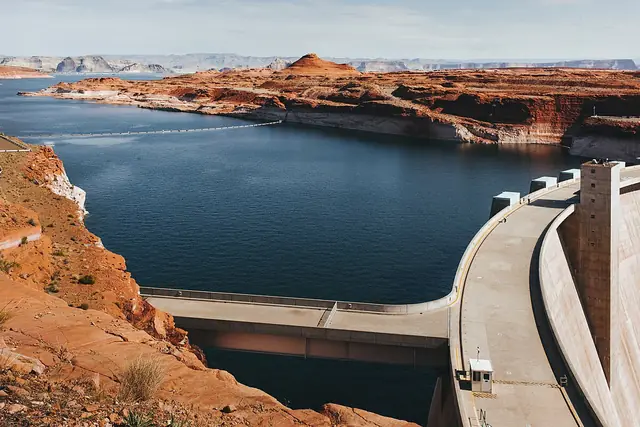
Lake Powell, UT
Lake Powell reads 3,539.3 ft, 43 ft below the usual level for these weeks (since 2016). It has started back up, 4.8 ft in the last week. Over 30 days it is up 20 ft. It sits 23 ft above the lowest reading we hold, which starts in 2016. At 61°F, striped bass are the bet here. Watch for birds and surface feeding. Start at a point drop-off in 4 to 16 ft; try swimbait or live shad where bait is. Thursday rates good for the bite.
Photo: Luca Bravo lucabravo (CC0)
-
2
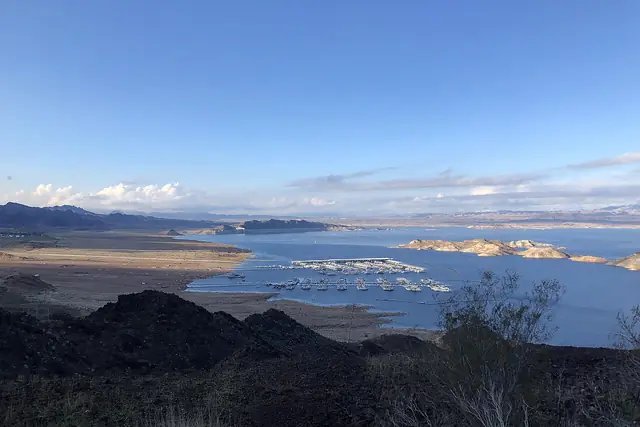
Lake Mead, NV
Lake Mead reads 1,040.2 ft, 31 ft below the usual level for these weeks (since 2016). It has started back up, 1 ft in the last week. Over 30 days it is up 2.5 ft. It sits 3 ft above the lowest reading we hold, which starts in 2016. 68°F at the surface puts largemouth bass first in line. They chase baitfish into creeks and coves. Start at a point drop-off in 20 to 24 ft; try swimbait or live shad where bait is. Go Thursday (good bite).
Photo: Julianibarra (CC0)
-
3
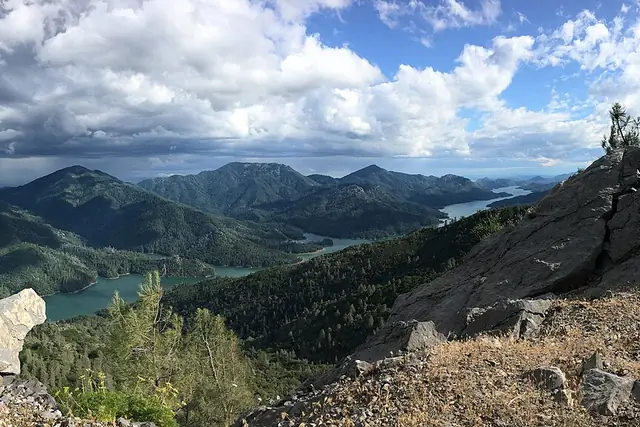
Shasta Lake, CA
Shasta Lake reads 971.1 ft, 16 ft below the usual level for these weeks (since 2016). It is still falling, 0.8 ft in the last week. Over 30 days it is down 7.5 ft. The water is 58°F and trout are in range. Near the surface and along shorelines. A point drop-off in 12 to 24 ft is the place to begin; try spinner or spoon, troll slowly. Thursday rates good for the bite.
Photo: Pacific Southwest Region 5 (public domain)
-
4
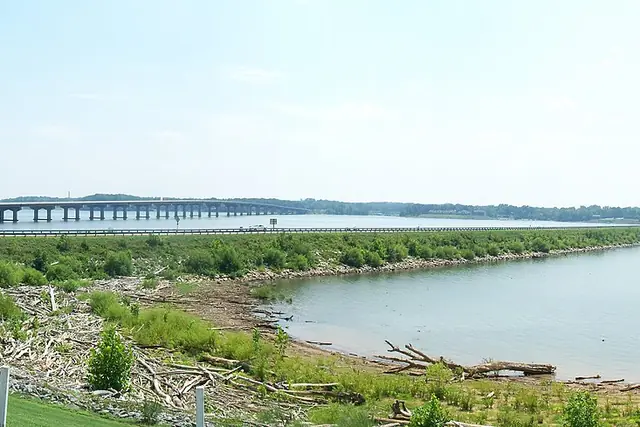
Kerr Lake, VA
Kerr Lake reads 287.5 ft, 11 ft below the usual level for these weeks (since 2016). The water is 61°F and largemouth bass are feeding. Start at a wind-blown bank; try spinnerbait or crankbait along the edge. Go Friday (good bite).
Photo: Idawriter, CC BY-SA 3.0
-
5
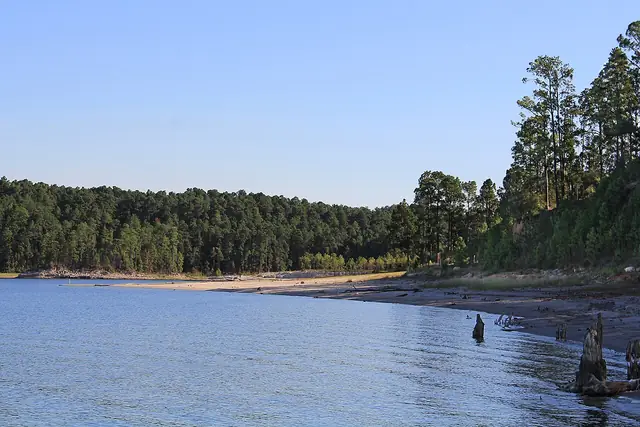
Sam Rayburn Reservoir, TX
Sam Rayburn Reservoir reads 152.7 ft, 8.7 ft below the usual level for these weeks (since 2016). The level has held about steady this week. Over 29 days it is down 1 ft. That is the lowest reading we hold for the lake, in a record that starts in 2016. At 65°F, largemouth bass are the bet here. An upper arm in 24 to 28 ft is the place to begin; try small jig or minnow under a float. 7 ft below its usual level, so fish crowd onto fewer points and short ramps may not reach the water. Go Thursday (good bite).
Photo: Ricraider, CC BY-SA 3.0
-
6
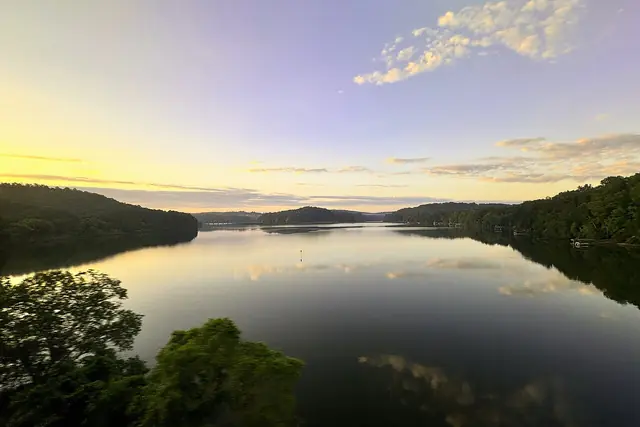
Lake Hartwell, SC
Lake Hartwell reads 647.6 ft, 8.5 ft below the usual level for these weeks (since 2016). The level has held about steady this week. Over 29 days it is down 1.7 ft. That is the lowest reading we hold for the lake, in a record that starts in 2016. The water is 65°F and striped bass are in range. A wind-blown bank in 4 to 16 ft is the place to begin; try swimbait or live shad where bait is. 5 ft below its usual level, so fish crowd onto fewer points and short ramps may not reach the water. Go Saturday (good bite).
Photo: Harrison Keely, CC BY 4.0
-
7
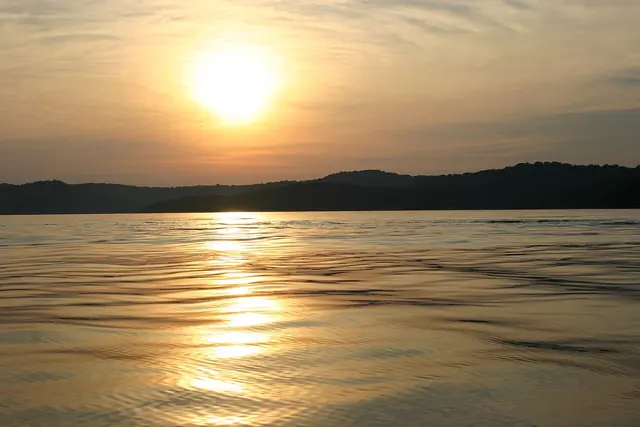
Beaver Lake, AR
Beaver Lake reads 1,111.2 ft, 7.5 ft below the usual level for these weeks (since 2016). It is still falling, 0.4 ft in the last week. Over 30 days it is down 1.4 ft. It sits 0.6 ft above the lowest reading we hold, which starts in 2016. 62°F at the surface puts striped bass first in line. A wind-blown bank in 4 to 16 ft is the place to begin; try swimbait or live shad where bait is. 5 ft below its usual level, so fish crowd onto fewer points and short ramps may not reach the water. Go Thursday (good bite).
Photo: Michaelkrewson at English Wikipedia (public domain)
-
8
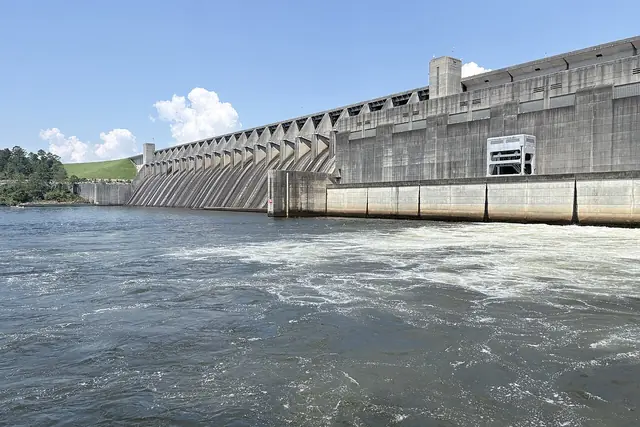
Lake Thurmond (Clarks Hill), GA
Lake Thurmond (Clarks Hill) reads 317.8 ft, 6.8 ft below the usual level for these weeks (since 2016). The level has held about steady this week. Over 29 days it is down 1.9 ft. That is the lowest reading we hold for the lake, in a record that starts in 2016. The water is 67°F and largemouth bass are feeding. A wind-blown bank is the place to begin; try swimbait or live shad where bait is. 8 ft below its usual level, so fish crowd onto fewer points and short ramps may not reach the water. Friday rates good for the bite.
Photo: Jcgaylor (CC0)
Water temperature on the list
Surface temperature on the latest clear reading for each lake, warmest first.
How to read 'below normal'
Normal is the level the same gauge showed in the same weeks of earlier years, in most cases every year since 2016, so it already allows for the usual fall drawdown. A lake 5 ft below normal is 5 ft lower than it usually is in this part of the year, not 5 ft below full.
The 'lowest reading we hold' is the bottom of our daily record for the lake, which starts around 2016. It is not the lowest the lake has ever been; most of these reservoirs have older, lower readings in their histories.
Where the fish go when the lake drops
Less water means less room: fish that spread over flats and into the backs of coves in a normal year stack on the points, channel bends and deep holes that are left. They are easier to find and quicker to spook, so make longer casts and lean on natural colours.
Falling water pulls fish out toward the first drop-off a little more every day; steady low water lets them settle on the deep edges. Either way, start at the mouths of coves and the ends of long points rather than the banks you fished in spring.
Before you go
Low water rearranges the hazards. Humps, stump fields and rock piles that were safe a few feet down are near the surface or dry, and the end of a short ramp can be in mud. Idle where you used to run, launch with a spotter, and check the lake page the morning you go: levels update every day.
Lake by lake
- Lake Powell61°F61°F water, level rising, 43 ft below normal, calm this morning.
- Lake Mead68°FClear water, 68°F water, level rising, 31 ft below normal, calm this morning.
- Shasta Lake58°FClear water, 58°F water, level falling, 16 ft below normal, calm this morning.
- Kerr Lake61°FClear water, 61°F water, level 287 ft, 11 ft below normal, calm this morning.
- Sam Rayburn Reservoir65°FClear water, 65°F water, level steady, 9 ft below normal, calm this morning.
- Lake Hartwell65°FClear water, 65°F water, level steady, 8 ft below normal, windy Thursday (18 mph W).
- Beaver Lake62°FSome algae possible, 62°F water, level falling, 7 ft below normal, calm this morning.
- Lake Thurmond (Clarks Hill)67°FClear water, 67°F water, level falling, 7 ft below normal, windy Thursday (16 mph W).
Your lake every morning
Water temperature, level, wind and bite times on your phone.

Read the guide
Related reports
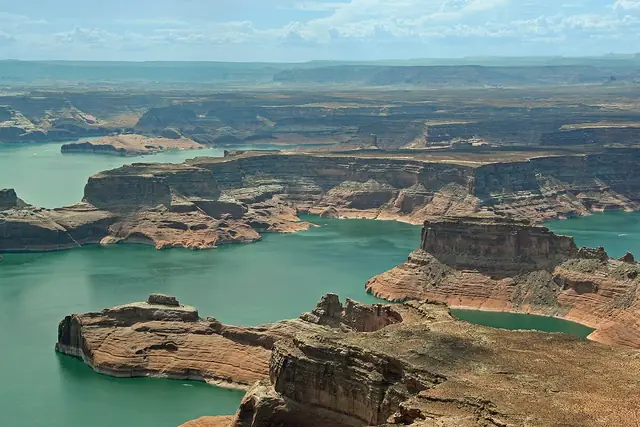 News brief Lake levels · Utah
Lake Powell up 20 ft in 30 days
Up 20 ft in a month, Lake Powell is flooding fresh cover.
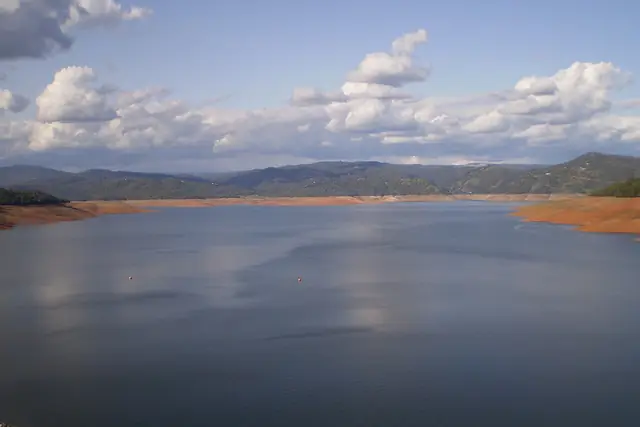 By the numbers Lake levels · California
6 numbers that explain Lake Oroville this week
The level, the trend and what they mean on the water: Lake Oroville in 6 numbers.
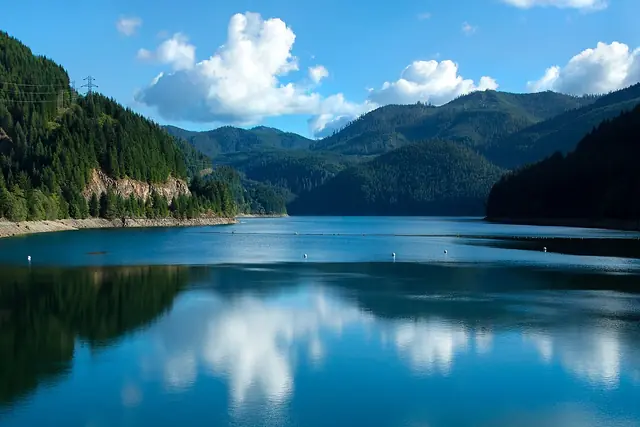 News brief Lake levels · Oregon
Detroit Lake down 18 ft in 29 days
Down 18 ft in a month, Detroit Lake is reshaping its banks.
By the numbers Lake levels · Nevada
Lake Mead by the numbers: 1,039.9 ft, +2.2 ft in 30 days
Everything that matters on Lake Mead this week, one number at a time.